
Massage Therapist Population Growth Curve Flattens in ABMP’s Recent Census
By Les Sweeney
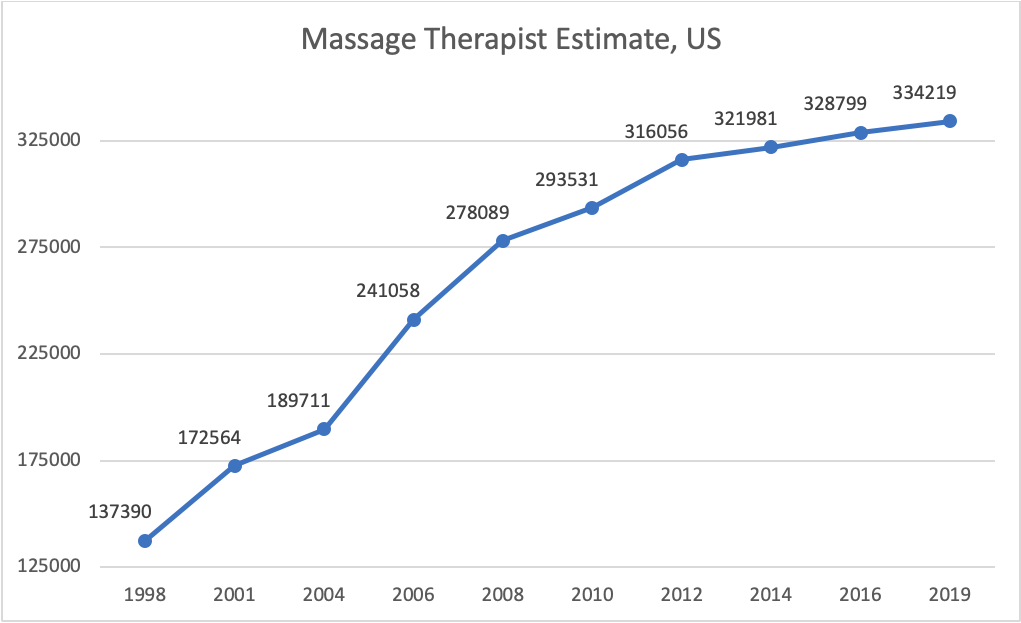
Every few years ABMP undertakes a process to query state massage therapy boards in order to prepare a massage therapist population estimate. Our 2019 effort puts the number of massage therapists in the United States at approximately 334,219, a 1.6 percent growth rate from 2016’s estimate of 328,799. (The 2016 estimate is available at www.abmp.com/updates/blog-posts/expect-more-les-massage-therapist-population-still-growing-very-slowly.)
From 1998 to 2012 our estimates show the massage therapist population growing 130 percent (from 137,390 to 316,056), but that steep growth curve has continued to flatten since then. This trend lines up with ABMP research into massage schools and graduates, which have declined from a peak in 2008.
The overall population estimate number does not exclude the estimated thousands of massage therapists that remain licensed but not in practice, so the number of practicing massage therapists is certainly lower than our overall number of licensed therapists, but it is very difficult to find a statistically meaningful measure to estimate that difference. One man’s guess? Perhaps as many as 20 percent of the 334,219 aren’t actively practicing; that would result in somewhere around 267,000 active practitioners.
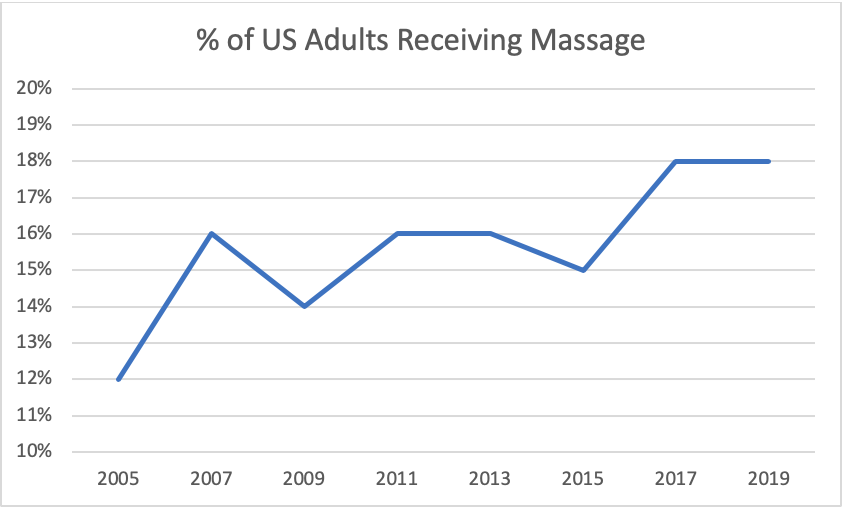
A natural follow-up question: If the number of massage therapists is relatively flat, what about demand for massage? ABMP’s biennial consumer research survey into massage consumer behavior suggests that 18 percent of adults in the US received a massage in 2018. Compared to 12 percent in the 2005 survey, and a median of 15 percent from 2007 to 2015, it seems safe to deduce that demand for massage therapy has increased over the past decade. Our research partners at Harstad Strategic Research would tell us that looking at that trendline, and given the sample sizes used to collect the data, in essence massage usage has grown since 2005, but more slightly when looking at the past five editions of the survey (a range of 16–18 percent).
If there are more massage consumers to go around for the same number of massage therapists, then supply and demand would tell us that the value of a massage is increasing. The consumer survey bears this out; average price for massage rose to $70 in 2017 and has remained there. (Though all of us in the massage community know that the true value of a massage is priceless!)
Methodology:
ABMP requests the number of active licensees from each state massage therapy board, and accesses official records where available. We then use the data from those lists to produce a final number for each state that excludes dual-licensed therapists who practice in multiple states, which reduces the overall number by about 7 percent. In unregulated states we estimate based on similar states and information about ABMP membership and other available profession data.
| State | 2019 State Population (000's) | 2019 Massage Therapist Population Estimate | 2019 Per Capita Estimate |
| AK | 737 | 1240 | 591.6 |
| AL | 4888 | 2008 | 2408.5 |
| AR | 3014 | 1801 | 1655.8 |
| AZ | 7172 | 9472 | 757.1 |
| CA | 39557 | 52931 | 732.1 |
| CO | 5696 | 12418 | 453.8 |
| CT | 3573 | 4898 | 729.4 |
| DC | 702 | 521 | 1147.9 |
| DE | 967 | 1360 | 703.8 |
| FL | 21299 | 36586 | 575.8 |
| GA | 10519 | 5840 | 1763.7 |
| HI | 1420 | 6144 | 228.6 |
| IA | 3156 | 3017 | 1040.4 |
| ID | 1754 | 1172 | 1489.4 |
| IL | 12741 | 9955 | 1253.3 |
| IN | 6692 | 3831 | 1690.3 |
| KS | 2912 | 1601 | 1856.1 |
| KY | 4468 | 2302 | 1921.0 |
| LA | 4660 | 2328 | 1981.3 |
| MA | 6902 | 7299 | 935.6 |
| MD | 6043 | 3669 | 1647.0 |
| ME | 1338 | 2451 | 546.1 |
| MI | 9996 | 8991 | 1100.2 |
| MN | 5611 | 5402 | 1060.4 |
| MO | 6126 | 4451 | 1368.8 |
| MS | 2987 | 723 | 4088.0 |
| MT | 1062 | 1657 | 637.8 |
| NC | 10384 | 8782 | 1163.9 |
| ND | 760 | 714 | 1052.9 |
| NE | 1929 | 1498 | 1274.4 |
| NH | 1356 | 1746 | 768.8 |
| NJ | 8909 | 7775 | 1145.8 |
| NM | 2095 | 2795 | 737.9 |
| NV | 3034 | 4624 | 649.4 |
| NY | 19542 | 11876 | 1664.4 |
| OH | 11689 | 10733 | 1089.1 |
| OK | 3943 | 2781 | 1447.3 |
| OR | 4191 | 7138 | 581.0 |
| PA | 12807 | 7995 | 1593.5 |
| RI | 1057 | 1138 | 919.0 |
| SC | 5084 | 3544 | 1371.3 |
| SD | 882 | 810 | 1055.1 |
| TN | 6770 | 4221 | 1587.2 |
| TX | 28702 | 28110 | 1010.4 |
| UT | 3161 | 6208 | 503.9 |
| VA | 8518 | 7123 | 1140.8 |
| VT | 626 | 907 | 712.6 |
| WA | 7536 | 13113 | 568.7 |
| WI | 5814 | 4760 | 1215.0 |
| WV | 1806 | 1027 | 1648.6 |
| WY | 578 | 735 | 802.4 |
| Sum/Average | 327167 | 334219 | 1177.8 |